“The complete evaporation of liquidity in certain market segments of the U.S. securitization market has made it impossible to value certain assets fairly regardless of their quality or credit rating.” BNP Paribas press release, August 9, 2007
In his memorable review of 21 books about the 2007-09 financial crisis, Andrew Lo evoked Kurosawa’s classic film, Rashomon, to characterize the remarkable differences between these crisis accounts. Not only were the interpretations in dispute, but the facts were as well: “Even its starting date is unclear. Should we mark its beginning at the crest of the U.S. housing bubble in mid-2006, or with the liquidity crunch in the shadow banking system in late 2007, or with the bankruptcy filing of Lehman Brothers and the ‘breaking of the buck’ by the Reserve Primary Fund in September 2008?”
In our view, the crisis began in earnest 10 years ago this week. On August 9, 2007, BNP Paribas announced that, because their fund managers could not value the assets in three mutual funds, they were suspending redemptions. With a decade’s worth of hindsight, we view this as a propitious moment to review both the precursors and the start of the worst financial crisis since the Great Depression of the 1930s. In future “10-years-after” posts, we hope to review other aspects of the crisis, including the various policy responses and key episodes involving runs on Bear Stearns, Lehman, the government-sponsored enterprises, and AIG.
But, first things first: What is a financial crisis? In our view, the term refers to a sudden, unanticipated shift from a reasonably healthy equilibrium—characterized by highly liquid financial markets, low risk premia, easily available credit, and low asset price volatility—to a very unhealthy one with precisely the opposite features. We use the term “equilibrium” to reflect a persistent state of financial conditions and note that—as was the case for Humpty Dumpty—it is easy to shift from a good financial state to a bad one, but very difficult to shift back again. The bad state is usually associated with increased co-movement of asset prices; contagion across firms, markets, and geographic jurisdictions; and an adverse feedback between the financial system and the real economy, so that as one deteriorates it makes the other even worse.
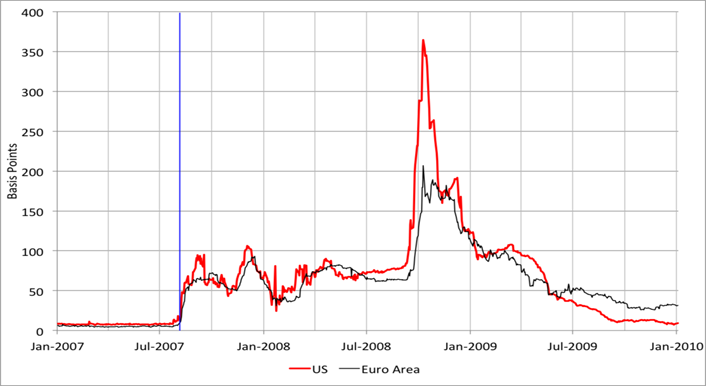
Below are two charts that highlight the dramatic impact of the August 9, 2007 Paribas event. Both exhibit a sudden shift from a good equilibrium to a bad one (which proceeded to worsen further as the crisis advanced). In the first chart, we show the classic fever thermometer of the crisis—the U.S. dollar three-month LIBOR-OIS spread—at a daily frequency (the red line). This spread is the difference between the interest rate at which top-quality banks in London claimed to be able to borrow from other banks in the uncollateralized market (LIBOR) for three months and a proxy for the expectations over the next three months of the safest, most liquid, nominal interest rate. It jumps on August 9 and does not sink back below this heightened level until after the Federal Reserve publishes the results of its first stress tests on May 7, 2009. The chart also highlights the rapid contagion of strains in this critical dollar funding market to the short-term market for funding in euros (the black line).

THREE-MONTH LIBOR-OIS INTEREST RATE SPREADS (BASIS POINTS), 2007-2009
Note: Vertical blue line denotes August 9, 2007 (BNP Paribas announcement). Source: Bloomberg.
We focus on the LIBOR-OIS spread because of what it measures. Viewed in isolation, the spread between the rate charged for providing a loan to a bank and one for a risk-free loan reflects the combination of a liquidity premium and compensation for counterparty risk. As the spread widens, we can infer that either liquidity is more expensive, the perceived risk of default is higher, or some mix of both. It seems likely that the initial shock was dominated by a broad scramble for liquid funds, as alternative means of financing suddenly dried up (especially in dollars and for shadow banks). However, during the remainder of 2007, as central banks moved aggressively to reduce bank (and shadow bank) short-term funding costs, the persistence of the LIBOR-OIS spread increasingly pointed to worries about counterparty solvency. Other indicators of funding disruption, such as the cross-currency basis swap that showed large and widening deviations from covered interest parity, exhibit the same pattern (see here).
Our second chart shows the (weekly) outstanding volume of asset-backed commercial paper (ABCP)—securities used by a range of intermediaries to fund large, highly-leveraged positions in mortgage-related securities (including mortgage-backed securities, MBS, and derivatives such as collateralized debt obligations, CDOs). The business model supporting the issuance of this debt simply collapsed on August 9. In previous years, banks had used their off-balance-sheet special investment vehicles (SIVs) to exploit this collateralized funding approach, allowing them to conceal increases in leverage and risk exposure. At its height, these SIVs financed more than $400 billion worth of mortgage-related assets, with no more than a tiny capital cushion. Why did the funding go away so suddenly? With hindsight, we can see that the purchasers of ABCP did not believe that they were being adequately compensated for the risk of SIV failure once mortgage delinquencies and defaults started to rise and it became clear that the market for the underlying mortgage-related instruments had evaporated.

UNITED STATES: ASSET-BACKED COMMERCIAL PAPER OUTSTANDING (WEEKLY WEDNESDAY, BILLIONS OF U.S. DOLLARS), 2001-JULY 26, 2017
Note: Vertical blue line denotes August 9, 2007 (BNP Paribas announcement). Source: FRED.
As Gorton has emphasized (see here and here), a key problem with various mortgage-related instruments used as funding collateral or held by issuers of ABCP was the complexity of their design and the way in which they repackaged risky subprime debt. This complexity made it impossible for investors at the other end of a long financing chain to distinguish quickly and cheaply between the “good” and the “bad” instruments. Put differently, investors were complacent in treating a large portion of these securities as information-insensitive. Thus, at least until mid-2007, the highest-quality tranches of mortgage related derivatives (such as AAA-rated senior CDOs) traded in markets with little premium relative to risk-free Treasury debt. As Acharya et al explain, by holding large amounts of these instruments, intermediaries “were in essence writing a very large out-of-the-money put option on the market” which they could not “make good when it counts.”
After August 9, investors recognized both the need and the inability to figure out which intermediaries holding mortgage-related instruments were stuck with the toxic components and which ones were not. This same challenge applied to the market for repurchase agreements (repo) where people were using these instruments as collateral for short-term loans. Gorton makes an analogy to the problem of tainted meat. Imagine you wake up one morning to news that some part of the hamburger supply is contaminated with a dangerous form of the bacteria E.coli. Most of us are not equipped to run safety tests on the meat that we purchase, so our natural reaction is to shift to eating something else for a while. In the same way that news about E.coli leads households to steer clear of hamburger, investors who are unprepared to do a detailed examination of structured financial products will stop buying them, accepting them as collateral, or lending to inadequately capitalized entities that hold them. Having failed to screen the ultimate borrowers adequately in advance, post-Paribas adverse selection undermined a range of financing mechanisms that relied on the collateral value of structured credit. The result was a large negative shock to the aggregate supply of credit precisely when intermediaries’ need for funds surged.
Why did this all happen on the day that it did? Even a brief scan of the timeline below leads anyone (including us) to wonder what was so special about August 9. The credit-fueled boom in U.S. housing prices had ended more than a year earlier; by the latter half of 2006, housing starts already had plunged by more than 20 percent year-on-year. Mortgage-related tensions had been evident for some time, as delinquencies were rising and prices for various tranches of MBS derivatives were falling. Key lenders in the subprime lending boom already had withdrawn or failed. Some banks had warned about mortgage-related losses. And, prominent “expert-managed” funds that specialized in mortgage-related securities had been wiped out.
Selected Events: Early Crisis Timeline, 2006-2007
| Apr 2006 | S&P/Case-Shiller 20-City Composite Home Price Index peaks |
| Late 2006 | Asset-backed securities index (ABX) begins declining for lower tranches of CDOs of subprime MBS |
| Feb 7, 2007 | HSBC raises provisioning as “slowing house price growth is being reflected in accelerated delinquency trends across the US sub-prime mortgage market” |
| Feb 27, 2007 | Freddie Mac announced it will no longer buy the riskiest subprime mortgages and MBS |
| Apr 2, 2007 | New Century Financial Corp. (leading subprime lender) bankruptcy |
| Jun 7, 2007 | Bear Stearns suspends redemptions from a leveraged, mortgage-related fund |
| Jun 23, 2007 | Bear Stearns pledges $3.2 billion to aid one of its ailing hedge funds |
| Jul 2007 | Declining ABX index for top-rated tranches of CDOs of subprime MBS |
| Jul 2007 | Credit rating agencies sharply downgrade hundreds of lower-rated securities backed by subprime mortgages |
| Jul 30, 2007 | Rescue of German IKB Bank (exposed to U.S. real estate related instruments) |
| Jul 31, 2007 | Bear Stearns liquidates two hedge funds that invested in MBS |
| Aug 6, 2007 | American Home Mortgage bankruptcy |
| Aug 9, 2007 | BNP Paribas halts redemptions from three mortgage-related investment funds |
| Aug 9, 2007 | Record ECB injection of €95 billion amid intraday jump in interbank loan rate |
| Aug 10, 2007 | FRB statement: “In current circumstances, depository institutions may experience unusual funding needs because of dislocations in money and credit markets. As always, the discount window is available as a source of funding.” |
| Sep 13, 2007 | Bank of England lends to Northern Rock, which soon faced a retail run |
| Oct 2007 | Major financial firms announce wave of subprime losses |
| Dec 12, 2007 | Five leading central banks coordinate to counter pressures in short-term funding markets; FRB establishes swap lines with ECB and SNB |
| Dec 17, 2007 | FRB Treasury Auction Facility: first provision of credit ($20 billion) |
Sources: Selections from FRB St Louis Crisis Timeline, FRB New York Financial Turmoil Timeline, BIS Timeline of Key Events, Lauder Institute Timeline, various news clippings, and authors.
Against this background, it is reasonable to conclude that, at the time of the BNP Paribas announcement, the system was extremely fragile, so it did not take much to bring it down. In this view, financial systems have multiple equilibria, so that a crisis requires only a spark to light the tinder that shifts the system from a good state to a bad one. The classic Diamond-Dybvig model of bank runs has exactly this property, as a loss of confidence leads to a self-fulfilling move from an equilibrium where everyone acts as if banks are solvent to one where no one does.
In our view, however, the real question is different: Why was the financial system so vulnerable that a relatively small disturbance could start a conflagration? When civil engineers build bridges, they look for ways to make them resilient to shocks, like high winds or the synchronized footsteps of pedestrians (consider the Tacoma Narrows bridge collapse in 1940 or London’s wobbly Millennium footbridge). Fortunately, engineers observing a vulnerability can temporarily close a bridge and install shock absorbers to make it function safely (as the builders of the London footbridge did in 2000).
We can’t shut down a modern financial system—at least not for long—without undermining the broader economy. So, system designers must anticipate the need for shock absorbers. With the benefit of hindsight, we can say with confidence that the U.S. and European financial systems in 2007 lacked two key shock absorbers: adequate capital to meet falls in asset values and defaults, and adequate holdings of high-quality liquid assets to meet a temporary liquidity shortfall.
In 2007, by far the more important vulnerability arose from a shortage of capital. As Greenlaw et al (2008) describe, mortgage losses undermined the capitalization of highly leveraged intermediaries, making them prone to runs. And, as Greenlaw et al (2011) further explain, creditors have no incentive to wait for intermediaries to become insolvent before they run: as a result, the threshold for a run usually occurs when the value of assets still exceeds those of liabilities.
Had commercial banks, SIVs, money market mutual funds, investment banks and the like been adequately capitalized and had sufficiently stable debt financing, central banks’ aggressive efforts to supply credit after August 2007 would likely have been adequate to lower funding costs and liquidity premia. These policy actions might also have provided time for creditors to figure out which of the mortgage-related securities were truly toxic.
While the aggregate capital shortfall is important for the system as a whole, shortfalls also matter for the individual intermediaries. To see this, consider the NYU Stern Volatility Lab’s estimates of systemic risk (SRISK), defined as the expected capital shortfall of an individual financial firm conditional on a large decline in the equity market. SRISK constitutes a real-time stress test both of specific financial firms and (viewed collectively) of the broader financial system. At the end of July 2007, shortly before the Paribas shock, only 20 of 93 large U.S. intermediaries exhibited any expected capital shortfalls. Of these 20, however, the top 10 accounted for 88 percent of the aggregate (SRISK) shortfall. Strikingly, over the course of the crisis, during the following 18 months, 9 of these 10 were either closed, folded into other intermediaries, nationalized, or bailed out with government equity injections as part of the 2008 Troubled Asset Relief Program! Had SRISK (or another measure of systemic risk) been publicly available in 2007, observers would have known the seriousness of the capital shortfall both for individual institutions and for the system well before the more acute phases of the crisis developed in 2008.
The bottom line: with the hindsight of 10 years, key facts about the financial crisis of 2007-09 are clear. What started as a loss of liquidity in the markets for complex, opaque mortgage-related instruments, on August 9 led suddenly to the evaporation of funding liquidity for intermediaries holding these securities (or trying to use them as collateral). It happened then because the system was exceptionally fragile, leaving it vulnerable even to small disturbances. And, by then, since European banks had been active in these U.S. markets, the problem was broadly international in scope (at least in Europe and North America). But, what made the crisis so deep and long—and so damaging to the global economy—was that the losses hit a financial system that was inadequately capitalized from the start.
We hope that, this week, regulators and market participants take a moment to recall these hard-earned lessons.